
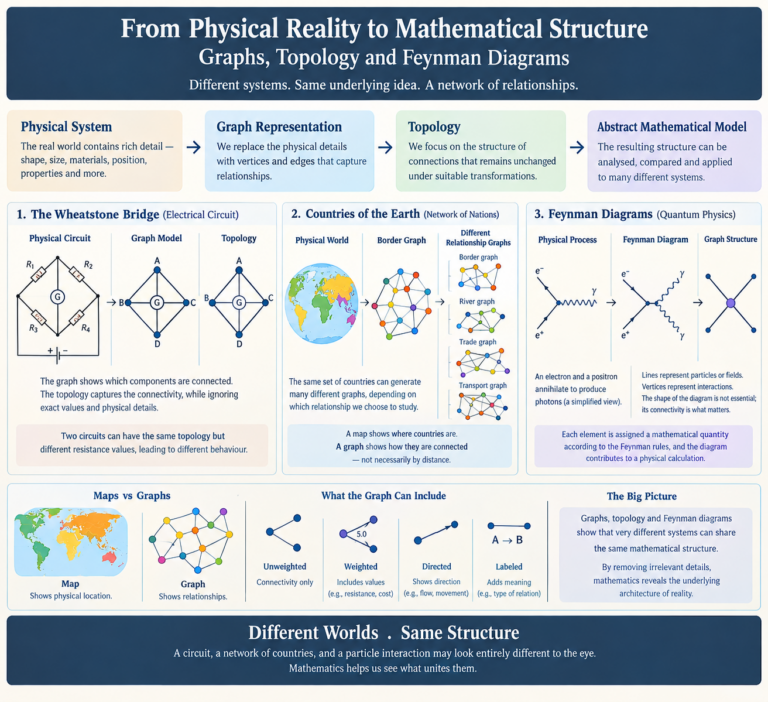
How mathematics strips away physical detail to reveal structure
One of the remarkable powers of mathematics is its ability to represent a complicated physical system without reproducing every detail of that system. A physical object may contain enormous amounts of information: its shape, dimensions, materials, location, temperature, colour, mass and countless other properties. Yet a mathematical model may deliberately ignore most of these features and retain only those relationships that are relevant to a particular problem.
Graph theory provides one of the clearest examples of this process of abstraction. A physical electrical circuit can be represented as a graph. A network of roads can become a graph. Countries can be represented as vertices connected according to geographical, economic or environmental relationships. Even interactions between elementary particles can be represented through graph-like structures known as Feynman diagrams.
The journey from a physical system to a graph therefore illustrates a much broader question: how does mathematics extract structure from reality?
From a Wheatstone Bridge to a Graph
Consider a physical Wheatstone bridge. It consists of resistors, wires, a source of electrical energy and a measuring instrument. Each component has physical properties. The resistors have particular resistance values, the wires have lengths and thicknesses, and the components occupy particular positions in space.
A graph of the circuit deliberately ignores most of these physical details.
The junctions can be represented by vertices, while the connections between them can be represented by edges. The resulting graph describes which parts of the circuit are connected to which others.
The physical circuit may be drawn in a square, a rectangle or an irregular arrangement. The wires can be bent or rearranged without necessarily changing the underlying connectivity.
The graph is therefore not a photograph of the circuit. It is an abstraction of its structure.
What the Graph Leaves Behind
This abstraction is powerful precisely because information has been discarded.
An ordinary graph does not know whether a wire is ten centimetres long or ten kilometres long. It does not know whether a resistor is made of carbon or metal. It does not know the temperature of the components or their physical dimensions.
It simply records relationships.
However, additional information can be attached to the graph. Resistance values can be assigned to edges, for example. The result is a weighted graph.
This distinction is important. Two electrical circuits can have exactly the same connectivity and therefore the same topology, while having completely different resistance values and consequently different electrical behaviour.
Thus, structural similarity does not necessarily imply physical or functional equivalence.
Topology Rather Than Topography
It is useful here to distinguish topology from topography.
Topography generally concerns the physical description of a surface or landscape. Topology is a branch of mathematics concerned with properties that remain unchanged under appropriate continuous transformations.
In the case of an electrical circuit, topology is concerned primarily with connectivity.
Imagine two circuits drawn in completely different ways. One might look like a square, while the other might be stretched into a complicated shape. If the same components are connected to the same junctions, their drawings may differ while their underlying topological structure remains the same.
This is why topology is so closely associated with graph theory.
Graph and Topology: The Difference
A graph is a mathematical object consisting fundamentally of vertices and edges. Topology describes structural properties that are preserved under suitable transformations.
In circuit analysis, a graph can therefore be used to represent the topology of the circuit.
The distinction becomes clearer when additional information is attached to the graph. A simple graph may record only connectivity. A weighted graph may additionally record resistance, capacity or some other numerical property. A directed graph may record the direction of a relationship.
Consequently, a richly labelled or weighted graph can contain more information than the underlying topology alone.
Topology asks, in essence, what structural relationships remain when details such as particular geometry and numerical values are ignored.
The graph provides a mathematical representation through which those relationships can be expressed.
A Hierarchy of Abstraction
We can therefore imagine a progression from reality towards mathematical abstraction.
At the first level is the physical system itself. It contains geometry, materials, dimensions, physical conditions and many other details.
At the next level is a mathematical model of the system. In the case of a circuit, this may be a graph whose vertices represent junctions and whose edges represent components or connections.
At a further level, we may focus only on the underlying topology and ignore numerical values and particular geometric arrangements.
Each stage deliberately discards information.
Yet something interesting happens as information is discarded: the resulting mathematical structure becomes more general.
The same graph-like structure can represent systems that have completely different physical meanings.
The Same Graph Can Represent Different Realities
A graph does not inherently know what its vertices and edges mean.
One graph could represent an electrical circuit. Another could represent cities connected by roads. Another could represent computers connected through a network. Another could represent relationships between people.
The mathematical structure can remain the same while the interpretation changes.
This is one of the deepest ideas in mathematical modelling.
The graph is not the system itself. It is a formal representation of selected relationships within the system.
Constructing a Graph of the Countries of the Earth
The same principle can be applied to countries.
Suppose each country is represented by a vertex. We can then define an edge according to a particular relationship.
If an edge means that two countries share a land border, we obtain a country-border graph.
But we could construct an entirely different graph using the same countries. An edge might represent a shared river system, a shared mountain system, an air connection, a trade relationship or some other interaction.
The vertices may remain the same while the edges change.
Consequently, there is no single uniquely determined “graph of the countries of the Earth”. There can be many different graphs, depending upon which relationship we wish to study.
A border graph represents geographical adjacency. A river graph represents hydrological relationships. A trade graph represents economic relationships. A transport graph represents transportation connectivity.
The mathematical representation therefore depends upon the question we are asking.
Maps and Graphs Are Not the Same Thing
This also reveals an important distinction between a geographical map and a graph.
A map primarily represents spatial location. It tells us where objects are located relative to one another.
A graph can completely ignore geographical location and concentrate instead on relationships.
Two countries can be geographically distant but strongly connected by trade or air travel. In a corresponding network graph, their physical distance may be irrelevant.
Conversely, two geographically adjacent countries may have very few connections of the particular type being represented.
A graph therefore does not necessarily attempt to reproduce physical reality visually. It extracts a particular relationship from reality and represents that relationship mathematically.
Feynman Diagrams: Graph Theory Enters Fundamental Physics
Perhaps one of the most striking examples of this idea occurs in modern physics.
Richard Feynman introduced a diagrammatic method for dealing with calculations in quantum electrodynamics in the late 1940s. What became known as Feynman diagrams provided physicists with a powerful graphical language for representing interactions between particles.
At first sight, a Feynman diagram appears simply to be a picture showing particles interacting. Mathematically, however, its structure is closely related to graph theory.
The lines of the diagram can be understood as edges, while interaction points can be understood as vertices.
A diagram may contain external lines, internal lines, interaction vertices and loops. These are all naturally describable using graph-theoretic language.
A tree-level Feynman diagram corresponds structurally to a graph without loops, while loop diagrams contain cycles.
The important point is that the particular shape of the lines on the page is generally not the essential information. What matters is how the lines and vertices are connected.
This is precisely the kind of abstraction characteristic of graph theory.
But a Feynman Diagram Is More Than an Ordinary Graph
It would nevertheless be an oversimplification to say that a Feynman diagram is simply a graph.
An ordinary mathematical graph tells us primarily about connectivity. A Feynman diagram carries a physical interpretation and is governed by a set of mathematical rules.
Different types of lines correspond to different particles or fields. Vertices represent particular interactions. Mathematical factors are associated with the elements of the diagram according to the relevant Feynman rules.
The diagram can therefore be translated into a mathematical expression that contributes to a physical calculation.
This makes the Feynman diagram a particularly sophisticated form of graph-based representation.
A useful conceptual progression is from a graph that records structure, to a labelled or weighted graph that records additional information, and finally to a physically interpreted graph whose components correspond to mathematical objects in a theory.
From Graph Structure to Physical Prediction
This is where Feynman diagrams differ fundamentally from simply drawing a network.
A road-network graph might tell us which cities are connected. A circuit graph might tell us which electrical components are connected. A Feynman diagram, however, participates directly in a calculation.
The graphical structure is translated into mathematical factors, and the resulting expressions contribute to quantities that can be compared with experimental observations.
Thus, the graph is no longer merely a convenient representation of a physical system. It becomes part of a computational framework for predicting physical phenomena.
This represents a fascinating reversal of the usual relationship between mathematics and physical reality.
In ordinary modelling, we might start with a physical system and construct a mathematical graph to describe it.
With Feynman diagrams, mathematical graph-like structures are used as part of the machinery through which we calculate properties of physical processes.
An Important Historical Qualification
It is therefore reasonable to describe Feynman diagrams as an important application and development of graph-like mathematical structures in physics.
However, it would be historically too strong to say that Feynman simply took graph theory and applied it to particle physics.
Feynman’s diagrammatic method arose from the perturbative formulation of quantum electrodynamics and the calculation of interaction amplitudes. The modern mathematical treatment of Feynman diagrams makes their graph-theoretic structure especially clear.
So the most accurate statement is that Feynman diagrams constitute a specialised physical and mathematical use of graph structures, enriched by the rules of quantum field theory.
They demonstrate how an abstract mathematical structure can become a language for expressing and calculating physical processes.
The Deeper Unity
The examples of the Wheatstone bridge, countries and Feynman diagrams may appear unrelated.
One belongs to electrical engineering.
Another belongs to geography and international relations.
The third belongs to fundamental physics.
Yet graph theory reveals a common structural language.
In the electrical circuit, vertices and edges describe connectivity.
In the country network, vertices and edges describe relationships between nations.
In the Feynman diagram, vertices and edges describe the structure of particle interactions and become ingredients in mathematical calculations.
The physical meanings are completely different, but the abstract mathematical idea of a network of relationships can be remarkably similar.
Mathematics as the Science of Abstraction
This leads to a broader philosophical observation about mathematics.
Mathematics does not always attempt to reproduce reality in all its complexity. Instead, it searches for structures that persist when irrelevant details are removed.
A physical Wheatstone bridge can be reduced to a circuit graph.
A geographical world of countries can be reduced to a network of relationships.
A complicated quantum-field interaction can be represented by a Feynman graph.
At each stage, the mathematical model is not identical to the physical reality. It is a selective representation of it.
The power lies precisely in that selectivity.
A graph removes physical shape but preserves connectivity. A topology removes even more detail and focuses on structural properties that survive appropriate transformations. A weighted or labelled graph can restore selected information when that information becomes relevant.
The result is a remarkable balance between abstraction and information.
From Reality to Structure
The journey can therefore be understood as a progression from physical reality to mathematical structure.
A physical system contains an enormous amount of information. A mathematical model selects the information relevant to a particular question. Graph theory provides a language for representing relationships. Topology identifies structural properties that survive changes in representation. And in areas such as quantum field theory, graph-like structures can become active components of sophisticated mathematical calculations.
This is why graph theory is more than the study of dots and lines.
It is a method of seeing.
It teaches us to look beyond the physical appearance of a system and ask what relationships actually define its structure.
A circuit, a network of countries and a particle interaction may look entirely different to the eye. Mathematics can nevertheless reveal a common architecture beneath them.
That may be one of the most powerful ideas in mathematics: when the superficial details are removed, very different parts of reality can reveal the same underlying structure.